

Lead Scoring Template: Fields, Points and Routing Rules
Build a Lead Scoring Template with fit and engagement criteria, point values, decay rules and routing thresholds you can test on past deals this week.
What changes when a lead's score moves from 62 to 78?
In plenty of companies, the honest answer is nothing. The number updates in a CRM field, a rep glances at it, and the same leads get worked in the same order as last quarter. The template got built, blessed in a meeting, and then slowly stopped mattering.
The problem usually starts with the definition. A lead scoring template isn't a points sheet. It's a written routing decision: this evidence, at this strength, sends this lead to this person inside this window. Every criterion that can't change who gets contacted, and how fast, is decoration. Once you treat the template that way, the fields, the decay rules and the validation all fall out of the same question.
Table of Contents
- Lead Scoring Template Fields and Point Values
- Rules-Based Scoring or a Predictive Model
- Decay Windows for Stale Buying Signals
- Routing Thresholds for Each Score Band
- Scoring One Lead End to End
- Validating the Template Before You Trust It
- Build, Test and Switch On the Template
Lead Scoring Template Fields and Point Values
Here's the starting table. It's plain on purpose, because a template a rep can't explain in one sentence is a template that gets ignored.
| Criterion | Layer | Starting points | Evidence to check |
|---|---|---|---|
| Job title is economic buyer or champion | Fit | +15 | Title in CRM or LinkedIn matches the target role list |
| Industry on ICP list | Fit | +10 | Industry field matches your best current customers |
| Company size in ICP range | Fit | +10 | Employee count falls inside your best-customer band |
| Served geography | Fit | +5 | Country or region you can sell to and support |
| Pricing page visit in last 14 days | Intent | +10 | Page view timestamp in web analytics |
| Demo or integration page visit | Intent | +15 | Page view tied to a known company or contact |
| Replied to a sequence email | Intent | +20 | Reply logged in the CRM activity history |
| Hiring or funding event in last 90 days | Intent | +10 | Dated job posting or funding news |
| Disposable email domain | Negative | -10 | Domain appears on a disposable-email list |
| Competitor or current vendor | Negative | -15 | Company name matches the competitor list |
| Outside served regions | Negative | -20 | Country code not in your service area |
The positive criteria total 95, so a lead that clears every fit box and shows genuine intent lands in the top band without anyone doing arithmetic in their head. Negatives subtract from that total, and the harshest of them can override it outright.
Why fit and intent sit in separate columns
A lead who matches your ICP perfectly but hasn't touched you in a month is a nurture candidate, not a hot lead. A lead who reads three pricing pages and never replies may be a student, a competitor, or an existing customer checking a renewal. One blended number hides that difference. Two columns tell the rep which conversation to have.
That distinction matters most when your funnel mixes channels. Paid social leads, webinar attendees and product signups don't behave alike, so it's worth being clear about what a digital marketing lead means before you hand all three the same fit points.
The test for any row: if scoring high here wouldn't change who calls this lead, or when they call, cut the row.
Treating the points as starting values
The points are starting values, not universal weights. What I'd defend in a design review is three independently auditable components, each scored on its own:
- Fit from stable attributes such as industry, geography, company size, technology and role.
- Intent from high-value events such as pricing or demo visits, hiring, funding, leadership changes or a reply.
- Negatives that subtract, covering disposable email domains, competitor status, poor geography and disqualifying firmographics, with recency decay applied so an old signal contributes less.
That three-layer split runs through the review of lead-scoring methods published in PubMed Central, and it's what keeps the template defensible when a rep asks why a 90-point lead turned out to be a competitor.
Recalibrate the numbers against closed-won and closed-lost accounts rather than against opinion. Build the first version in a spreadsheet, one row per criterion, with a notes column recording why the criterion earns its points and who last changed it. That column is the audit trail you'll want the first time someone disputes a score.
Rules-Based Scoring or a Predictive Model
Two model families sit behind every template, and the one you pick decides what evidence you need before you can start.
The split is simple on paper. One path writes the weights by hand, the other learns them from outcomes.
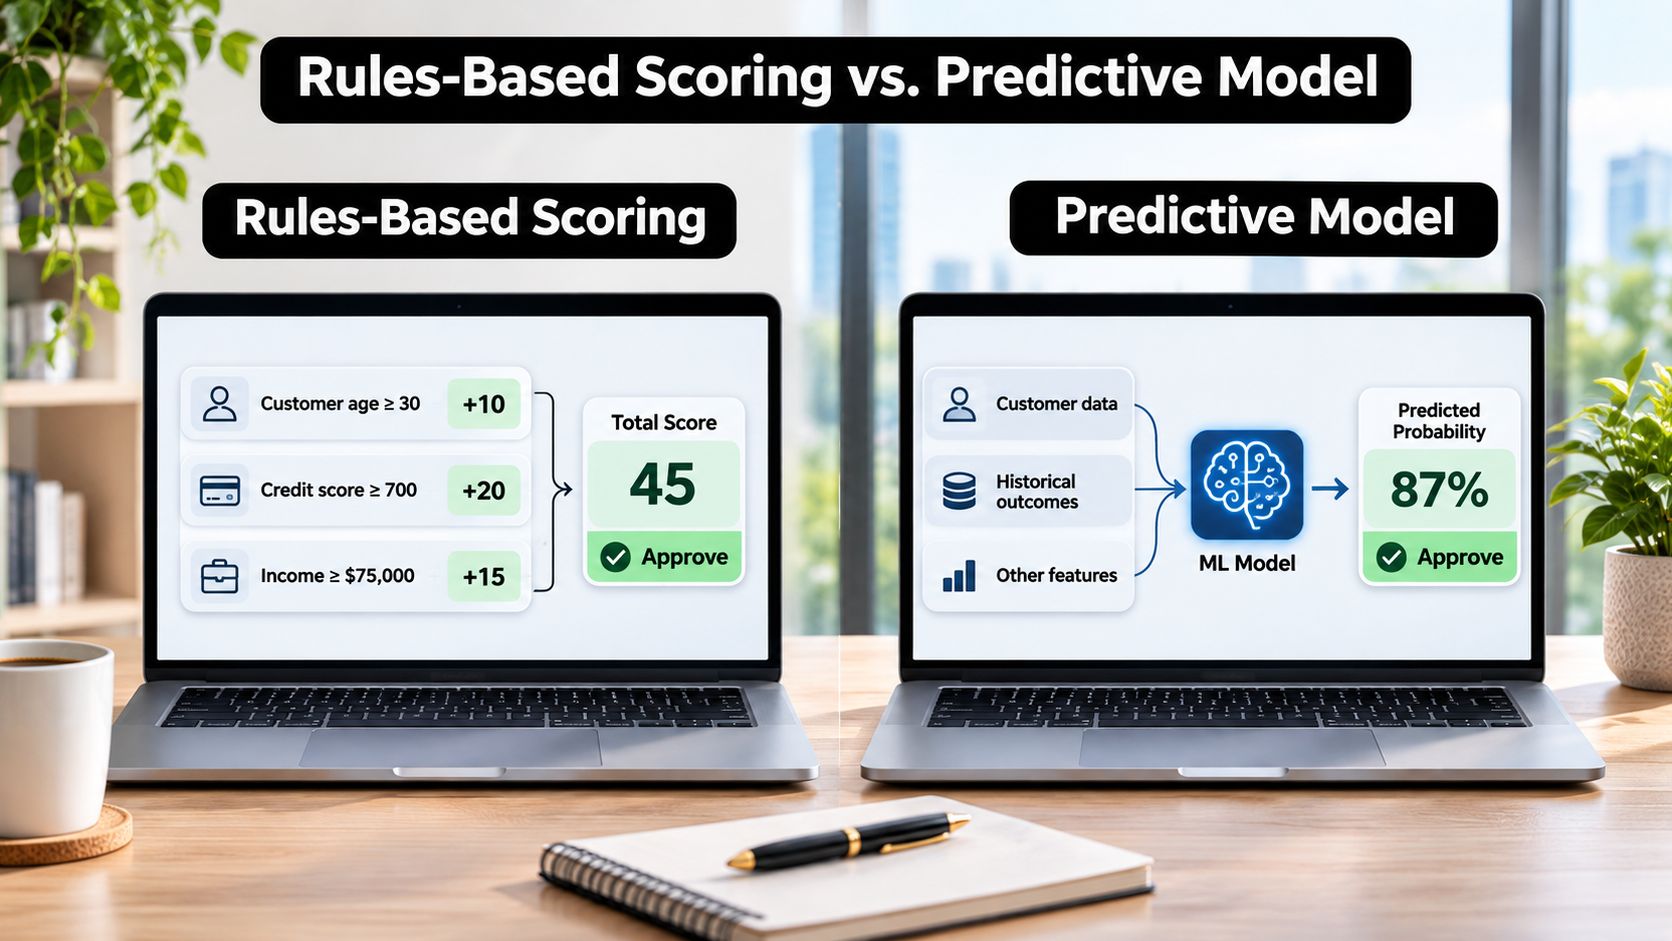
A rules-based template is the points sheet a team writes from experience: fit, behavior and negatives, each carrying a value someone argued for. A predictive model learns those weights from historical outcomes, using data-mining or machine-learning methods to estimate which leads are most likely to purchase. Both rank leads by purchase likelihood. They differ in how the evidence is generated and how often it refreshes, as a 2023 systematic review of lead-scoring methods describes in its comparison of traditional ranking against predictive scoring.
Decision rule: if your CRM can't tell you which leads were won and which were lost over the past year, stop building. Fix the outcome fields first.
Start with rules. They're fast to write, cheap to change, and a rep can see exactly why a lead scored 85. Predictive models earn their place once there are enough labeled outcomes to hold back an untouched test set, and enough volume for the model to learn something stable.
Adoption is drifting toward the learned end. In 2024, 36% of HubSpot survey respondents reported using AI for forecasting, lead scoring or pipeline analysis, while 22% used AI to qualify leads, according to HubSpot's state of AI in sales report. That second number is the honest one: teams are still running on rules.
The fit layer moves slowly, so its weights can hold for a year. The behavior layer needs checking against results far more often, because buyer behavior shifts faster than your ICP does. Two questions you can answer today: are the outcome fields filled in for the last year of leads, and can anyone on the team name the three signals that most often came before a win?
Decay Windows for Stale Buying Signals
A pricing page visit looks like a buying signal and often isn't. The same page draws students writing a comparison essay, a competitor checking your packaging, and an existing customer confirming what they already pay. Interest, yes. Budget, authority and a live project, no. Most templates walk straight into that gap by awarding ten points and firing an alert.
The fix is separating what a lead is from what a lead is doing right now. Fit shouldn't decay, because a 120-person software company in your served region stays that size next quarter. Intent should decay, and quickly. Practitioner analysis of intent data makes the same point: signals go stale fast, and a trigger from six weeks ago often describes fit better than timing, as this Martal breakdown of potential customers warns.
| Signal | Full points window | After |
|---|---|---|
| Demo or integration page visit | 0 to 30 days | 31 to 60 days at half points, over 60 zero |
| Replied to sequence email | 0 to 30 days | 31 to 60 days at half points, over 60 zero |
| Pricing page visit | 0 to 14 days | 15 to 30 days at half points, over 30 zero |
| Hiring or funding event | 0 to 90 days | 91 to 180 days at half points, over 180 zero |
| Fit criteria (role, industry, size, geography) | No decay | No decay |
A worked case makes the point. A demo page visit twelve days ago keeps its full points. A pricing visit from 42 days ago has cleared both the 14-day full window and the half-point window, so it contributes zero, while the same lead's fit points sit untouched at 40. Nothing about the account changed. Only the timing did.
Setting the window from your own won deals
Don't guess at the numbers. Pull your won deals, measure the days between the last meaningful engagement and opportunity creation, then pick a window that covers most of those wins. One published recommendation uses an 80% coverage heuristic while stressing that it isn't a universal standard. That matches what I'd recommend: use the figure that fits your own win history, then check it by segment, because an enterprise deal and a self-serve signup don't cool at the same rate. The guide to buying signals and outreach timing covers the signal side of that split.
Then wire the routing rule. Uncorroborated intent goes to hold or nurture, never straight to a sales alert. A score built on one pricing visit is a question, not a lead.
Routing Thresholds for Each Score Band
A band that names no owner and no first-touch target is a label, not a rule. Here's the starting set.
| Score band | Action | Owner | First-touch target |
|---|---|---|---|
| 80 and above | Route to sales now | Account executive | Same business day |
| 60 to 79 | Sales review, then short sequence | SDR | Within 1 business day |
| 40 to 59 | Nurture track, no sales alert | Marketing ops | Next scheduled review |
| Below 40, no flags | Keep in database, re-score on new signal | Marketing ops | Re-score on next signal |
| Any negative flag | Hold for manual review | Revenue operations | Within 2 business days |
Thresholds belong to capacity, not to round numbers. Route to sales when a lead's expected value clears the cost of following it up, and not before. If your reps can hold fifteen real conversations a day, the top band has to stay small enough to be worked the same day. A band nobody can clear by lunchtime trains people to ignore the whole system. When you're picking tooling to enforce those rules, the breakdown of lead routing software and faster sales follow-up covers what needs to happen at the moment a score crosses a threshold.
The concentration is real. In one ranking analysis, the top 10% of leads accounted for 44.1% of seven-day conversions, against the 10% random selection would capture, and in a two-product-line comparison, sales teams shown lead grades converted 31% and 37% higher than matched teams that received none, as this collection of lead-scoring statistics records. Narrow top bands aren't stingy. They're where the near-term opportunity sits.
Negative flags override everything above. A disposable email domain or a competitor name sends the lead to manual review regardless of total points, because the arithmetic was never designed to outvote a disqualifier.
Rep test: every rep should be able to say, unprompted, why a lead landed in the band it did. If the answer is "it's just the score", the template has already failed.
Review the bands when the share of leads in each one drifts. A top band that swells from 5% to 20% of inbound usually means a criterion started matching everyone, not that demand tripled.
Scoring One Lead End to End
Arithmetic is where templates get caught, so here's one lead scored line by line. The lead: a head of revenue operations at a 120-person software company in a country you serve.
- Fit, +40. Title on the target list (+15), industry on the ICP list (+10), company size inside the band (+10), served geography (+5).
- Demo page visit 12 days ago, +15. Comfortably inside the full window.
- Hiring event 60 days ago, +10. Inside the 90-day full window, so no decay yet.
- Reply to a sequence email three weeks ago, +20. Still inside its full window.
- Pricing visit 40 days ago, zero. Past the cutoff, so it adds nothing.
Total: 85. That lands in the route-to-sales band, and the rep gets it the same business day.
Now change one input. Variant one: strip out the reply and the same lead scores 65, which drops it to the sales review band and a one-day first touch. Same person, different evidence, different handling.
Variant two: keep all 85 points and add a disposable email domain. The minus 10 brings the total to 75, but the flag overrides the band and the lead goes to manual review instead. Two mechanisms did the work, and the rep can see both.
Every number traces to a row in the criteria table and a dated piece of evidence. That traceability is the point. When a 75-point lead turns out to be a competitor, you fix the row that gave it points, not the rep who worked it.
Validating the Template Before You Trust It
A model reporting 0.9839 accuracy can still hand your reps a pipeline full of nothing. Accuracy flatters a lopsided dataset: when one lead in fifty becomes an opportunity, a model that says no to everything is right 98% of the time and finds you zero deals.
The sequence below is the one I'd follow before switching anything live.
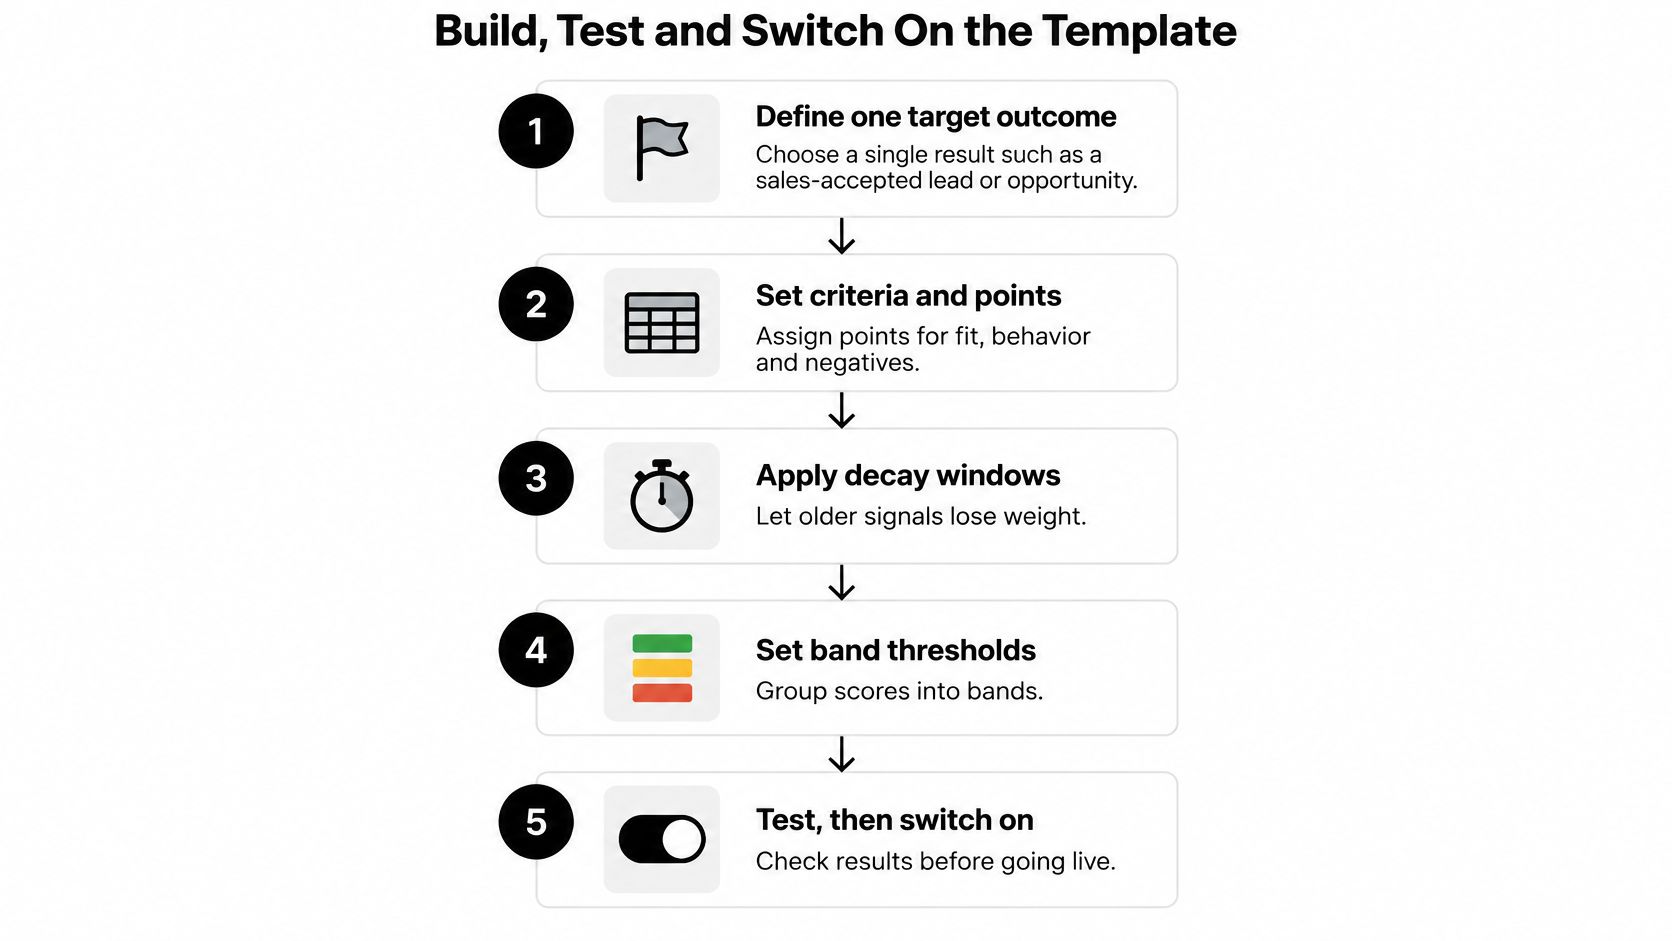
The scale problem is concrete. A reviewed 2025 case study cut 23,154 Microsoft Dynamics records to 16,600 after cleaning and compared 15 algorithms; gradient boosting reached 0.9839 accuracy, and the authors still warn that severe class imbalance makes accuracy misleading and that results from one SME don't generalize, as this lead-scoring framework breakdown reports. High accuracy that misses the minority of leads who become opportunities is worse than useless, because it looks like proof.
Selection bias is the quieter failure. If reps only ever worked the leads an old score ranked high, historical conversion data mostly records who was contacted, not who was worth contacting. Train on that and the model learns your old routing policy and calls it truth. The input side matters just as much, which is why the data integrity checks for CRMs and customer databases are the unglamorous half of validation: deduplicated contacts, normalized industry fields, missing values marked rather than guessed.
Hold the template to four measures, in this order:
- Precision and recall on the one outcome you chose, not on a proxy like email opens.
- Lift over the current process, meaning the unscored way you route leads today.
- Conversion rate by score band, which should climb from the bottom band to the top. If the top band converts no better than the middle, your weights are decoration.
- Calibration and false-positive rate, so a score of 80 means roughly what it claims to mean.
If you want the walkthrough version of this, the video below covers the same ground.
Record, for every lead, the score, confidence, evidence quality, routing action, response time and eventual outcome. Then add a holdout group that gets no priority routing, or run a randomized routing test for a fixed period. That's the only honest way to estimate incremental impact rather than reproducing what reps did last year.
Monthly check: lift against baseline, conversion by band, time to first touch, false-positive rate, and any signal that has stopped predicting. A criterion that quietly stopped working is worse than no criterion, because it still looks like evidence.
Build, Test and Switch On the Template
The build is short and unforgiving. Each step has one specific way to get it wrong.
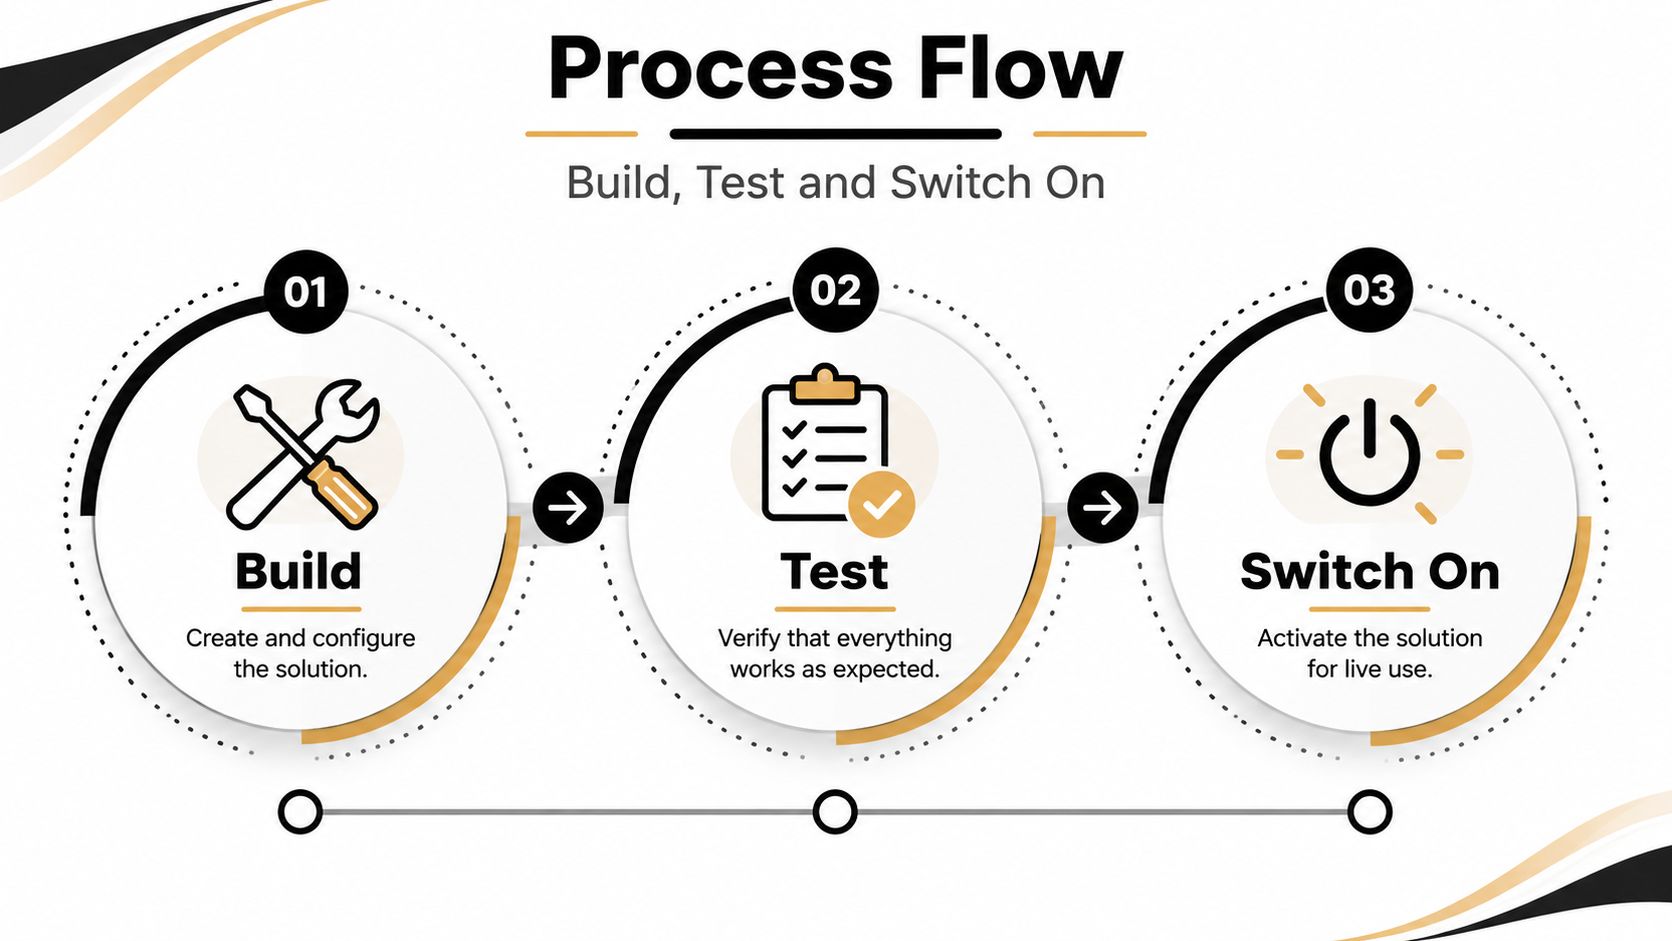
- Define one target outcome. Sales-accepted lead or opportunity created works. Slip: choosing closed-won, which makes the score wait a quarter or more before it can prove anything.
- Pull won and lost records from the same period and freeze the observation window before the outcome happened. Slip: using activity logged after the deal closed, which leaks the future into the score. A supervised workflow that names one unambiguous target and freezes the window avoids most of this, as this guide to supervised lead-scoring workflows sets out.
- Clean the base. Deduplicate contacts and accounts, normalize industry and company-size fields, mark missing values. Slip: scoring a blank field as a zero.
- Split fit columns from behavior columns so each can be audited alone. Slip: blending them into one formula nobody can unpick later.
- Assign starting points from the criteria table and check each one against won deals. Slip: giving points to a signal most won deals never had.
- Set bands, owners and first-touch targets from the band table. Slip: naming a band without naming a person.
- Score ten won and ten lost leads by hand. Won leads should land in the top bands and lost ones shouldn't. Adjust one criterion at a time, so you can see which change moved the result.
- Choose the alert channel and switch routing on. Slip: going live on a channel nobody watches, which is how most templates die.
A spreadsheet is enough for a small team with a clean outcome field. When the hand-maintenance gets old, ready-made templates that carry CRM signals, enrichment and signup scoring do the same job, and a one-click HubSpot, Pipedrive or Attio connection lands each change on the record and in Slack with a drafted first line.
CapyScout scores every new signup in seconds and returns a plain label, fit, risk and confidence scores, a recommended action and a suggested reply, with the evidence behind each call attached to the record. That's the same discipline this template asks for, applied to live inbound traffic instead of a spreadsheet of past guesses. If you want to see a routing decision made at the moment a lead arrives, visit CapyScout.
Not ready to start? Get a free target list: 10 companies to sell to, picked from your website.